前言

在 Hexo + Butterfly 搭建的个人博客中,很多站长希望用动态数据图表替代静态图片,用来展示访问统计、技术趋势或项目进度。ECharts 作为百度开源的强大可视化库,支持折线图、柱状图、饼图、地图等数十种图表类型,交互体验优秀。

但 Butterfly 主题默认并未集成 ECharts,直接在前台插入脚本容易出现 JS 冲突、资源重复加载、响应式失效 等问题。本文针对 Butterfly 主题,提供一套无插件、低侵入、可维护的引入方案,适配桌面端、平板与移动端。

准备工作

  • 已安装 Hexo(5.0+)

  • 已启用 Butterfly 主题:theme: butterfly

引入 ECharts 图表资源

传统方式引入

  • 编辑 _config.butterfly.yml 或 themes\butterfly\_config.yml 中配置项
1
2
3
4
5
inject:
head:
# - <link rel="stylesheet" href="/xxx.css">
# ECharts图表
- <script src="https://cdn.jsdelivr.net/npm/echarts@6.1.0/dist/echarts.min.js"></script>

status.pug 方式引入 ECharts(Butterfly 专属)

已经为 Butterfly 主题自定义过 站点状态页,并通过 status.pug 接管了 source/status/index.md 的渲染逻辑,那么可以直接开启 ECharts 引入,避免在全局页面重复加载图表库。

  • 编辑 source\status\index.md 中配置项
1
2
3
4
5
---
title: 站点状态
# 省略...
echarts: true
---
参数 解释
echarts 是否加载 ECharts 库文件,填写 true 或者 false

创建 ECharts 初始化脚本

  • 在 themes\butterfly\scripts\helpers\ 目录下新建 charts.js 文件
1
2
3
4
5
6
7
8
9
10
11
12
13
14
15
16
17
18
19
20
21
22
23
24
25
26
27
28
29
30
31
32
33
34
35
36
37
38
39
40
41
42
43
44
45
46
47
48
49
50
51
52
53
54
55
56
57
58
59
60
61
62
63
64
65
66
67
68
69
70
71
72
73
74
75
76
77
78
79
80
81
82
83
84
85
86
87
88
89
90
91
92
93
94
95
96
97
98
99
100
101
102
103
104
105
106
107
108
109
110
111
112
113
114
115
116
117
118
119
120
121
122
123
124
125
126
127
128
129
130
131
132
133
134
135
136
137
138
139
140
141
142
143
144
145
146
147
148
149
150
151
152
153
154
155
156
157
158
159
160
161
162
163
164
165
166
167
168
169
170
171
172
173
174
175
176
177
178
179
180
181
182
183
184
185
186
187
188
189
190
191
192
193
194
195
196
197
198
199
200
201
202
203
204
205
206
207
208
209
210
211
212
213
214
215
216
217
218
219
220
221
222
223
224
225
226
227
228
229
230
231
232
233
234
235
236
237
238
239
240
241
242
243
244
245
246
247
248
249
250
251
252
253
254
255
256
257
258
259
260
261
262
263
264
265
266
267
268
269
270
271
272
273
274
275
276
277
278
279
280
281
282
283
284
285
286
287
288
289
290
291
292
293
294
295
296
297
298
299
300
301
302
303
304
305
306
307
308
309
310
311
312
313
314
315
316
317
318
319
320
321
322
323
324
325
326
327
328
329
330
331
332
333
334
335
336
337
338
339
340
341
342
343
344
345
346
347
348
349
const cheerio = require("cheerio");
const moment = require("moment");

hexo.extend.filter.register(
"after_render:html",
function (locals) {
const $ = cheerio.load(locals);
const post = $("#posts-chart");
const tag = $("#tags-chart");
const category = $("#categories-chart");
const htmlEncode = false;

if (post.length > 0 || tag.length > 0 || category.length > 0) {
if (post.length > 0 && $("#postsChart").length === 0) {
if (post.attr("data-encode") === "true") htmlEncode = true;
post.after(postsChart(post.attr("data-start")));
}
if (tag.length > 0 && $("#tagsChart").length === 0) {
if (tag.attr("data-encode") === "true") htmlEncode = true;
tag.after(tagsChart(tag.attr("data-length")));
}
if (category.length > 0 && $("#categoriesChart").length === 0) {
if (category.attr("data-encode") === "true") htmlEncode = true;
category.after(categoriesChart(category.attr("data-parent")));
}

if (htmlEncode) {
return $.root()
.html()
.replace(/&amp;#/g, "&#");
} else {
return $.root().html();
}
} else {
return locals;
}
},
15,
);

function postsChart(startMonth) {
const startDate = moment(startMonth || "2020-01");
const endDate = moment();

const monthMap = new Map();
const dayTime = 3600 * 24 * 1000;
for (let time = startDate; time <= endDate; time += dayTime) {
const month = moment(time).format("YYYY-MM");
if (!monthMap.has(month)) {
monthMap.set(month, 0);
}
}
hexo.locals.get("posts").forEach(function (post) {
const month = post.date.format("YYYY-MM");
if (monthMap.has(month)) {
monthMap.set(month, monthMap.get(month) + 1);
}
});
const monthArr = JSON.stringify([...monthMap.keys()]);
const monthValueArr = JSON.stringify([...monthMap.values()]);

return `
<script id="postsChart">
var color = '#555555';
var postsChart = echarts.init(document.getElementById('posts-chart'), 'light');
var postsOption = {
title: {
text: '文章发布统计图',
left: 'center',
top: 10,
textStyle: { color: color, fontSize: 18, fontWeight: 'bold' }
},
grid: {
top: 70,
bottom: 60,
left: 60,
right: 30
},
tooltip: {
trigger: 'axis',
textStyle: { fontSize: 14 }
},
xAxis: {
name: '日期',
type: 'category',
boundaryGap: false,
nameTextStyle: { color: color, fontSize: 14 },
axisTick: { show: false },
axisLabel: { show: true, color: color, fontSize: 13 },
axisLine: { show: true, lineStyle: { color: color } },
data: ${monthArr}
},
yAxis: {
name: '文章篇数',
type: 'value',
nameTextStyle: { color: color, fontSize: 14 },
splitLine: { show: false },
axisTick: { show: false },
axisLabel: { show: true, color: color, fontSize: 13 },
axisLine: { show: true, lineStyle: { color: color } }
},
series: [{
name: '文章篇数',
type: 'line',
smooth: true,
lineStyle: { width: 0 },
showSymbol: false,
itemStyle: {
opacity: 1,
color: new echarts.graphic.LinearGradient(0, 0, 0, 1, [
{ offset: 0, color: 'rgba(153, 102, 255, 0.95)' },
{ offset: 1, color: 'rgba(255, 99, 180, 0.95)' }
])
},
areaStyle: {
opacity: 1,
color: new echarts.graphic.LinearGradient(0, 0, 0, 1, [
{ offset: 0, color: 'rgba(153, 102, 255, 0.55)' },
{ offset: 1, color: 'rgba(255, 99, 180, 0.25)' }
])
},
data: ${monthValueArr},
markLine: {
data: [{ name: '平均值', type: 'average', label: { color: color, fontSize: 13 } }]
}
}]
};
postsChart.setOption(postsOption);
window.addEventListener('resize', () => { postsChart.resize(); });
postsChart.on('click', 'series', (event) => {
if (event.componentType === 'series') window.location.href = '/archives/' + event.name.replace('-', '/');
});
</script>`;
}

function tagsChart(len) {
const tagArr = [];
hexo.locals.get("tags").map(function (tag) {
tagArr.push({ name: tag.name, value: tag.length, path: tag.path });
});
tagArr.sort((a, b) => b.value - a.value);

const dataLength = Math.min(tagArr.length, len) || tagArr.length;
const tagNameArr = [];
for (let i = 0; i < dataLength; i++) {
tagNameArr.push(tagArr[i].name);
}
const tagNameArrJson = JSON.stringify(tagNameArr);
const tagArrJson = JSON.stringify(tagArr);

return `
<script id="tagsChart">
var color = '#555555';
var tagsChart = echarts.init(document.getElementById('tags-chart'), 'light');
var tagsOption = {
title: {
text: 'Top ${dataLength} 标签统计图',
left: 'center',
top: 10,
textStyle: { color: color, fontSize: 18, fontWeight: 'bold' }
},
grid: {
top: 70,
bottom: 60,
left: 60,
right: 30
},
tooltip: {
textStyle: { fontSize: 14 }
},
xAxis: {
name: '标签',
type: 'category',
nameTextStyle: { color: color, fontSize: 14 },
axisTick: { show: false },
axisLabel: { show: true, color: color, interval: 0, rotate: 30, fontSize: 13 },
axisLine: { show: true, lineStyle: { color: color } },
data: ${tagNameArrJson}
},
yAxis: {
name: '文章篇数',
type: 'value',
splitLine: { show: false },
nameTextStyle: { color: color, fontSize: 14 },
axisTick: { show: false },
axisLabel: { show: true, color: color, fontSize: 13 },
axisLine: { show: true, lineStyle: { color: color } }
},
series: [{
name: '文章篇数',
type: 'bar',
data: ${tagArrJson},
itemStyle: {
borderRadius: [5, 5, 0, 0],
color: new echarts.graphic.LinearGradient(0, 0, 0, 1, [
{ offset: 0, color: 'rgba(153, 102, 255, 0.85)' },
{ offset: 1, color: 'rgba(255, 99, 180, 0.85)' }
])
},
emphasis: {
itemStyle: {
color: new echarts.graphic.LinearGradient(0, 0, 0, 1, [
{ offset: 0, color: 'rgba(173, 122, 255, 0.85)' },
{ offset: 1, color: 'rgba(255, 119, 200, 0.85)' }
])
}
},
markLine: {
data: [{ name: '平均值', type: 'average', label: { color: color, fontSize: 13 } }]
}
}]
};
tagsChart.setOption(tagsOption);
window.addEventListener('resize', () => { tagsChart.resize(); });
tagsChart.on('click', 'series', (event) => {
if(event.data.path) window.location.href = '/' + event.data.path;
});
</script>`;
}

function categoriesChart(dataParent) {
const categoryArr = [];
let categoryParentFlag = false;
hexo.locals.get("categories").map(function (category) {
if (category.parent) categoryParentFlag = true;
categoryArr.push({
name: category.name,
value: category.length,
path: category.path,
id: category._id,
parentId: category.parent || "0",
});
});
categoryParentFlag = categoryParentFlag && dataParent === "true";
categoryArr.sort((a, b) => b.value - a.value);

function translateListToTree(data, parent) {
let tree = [];
let temp;
data.forEach((item, index) => {
if (data[index].parentId == parent) {
let obj = data[index];
temp = translateListToTree(data, data[index].id);
if (temp.length > 0) {
obj.children = temp;
}
tree.push(obj);
}
});
return tree;
}

const categoryNameJson = JSON.stringify(
categoryArr.map(function (category) {
return category.name;
}),
);
const categoryArrJson = JSON.stringify(categoryArr);
const categoryArrParentJson = JSON.stringify(
translateListToTree(categoryArr, "0"),
);

return `
<script id="categoriesChart">
var color = '#555555';
var categoriesChart = echarts.init(document.getElementById('categories-chart'), 'light');
var categoryParentFlag = ${categoryParentFlag};

categoriesChart.setOption({
color: [
'rgba(153,102,255,0.85)',
'rgba(255,99,180,0.85)',
'rgba(138,43,226,0.85)',
'rgba(255,105,180,0.85)',
'rgba(180,120,255,0.85)',
'rgba(255,140,200,0.85)',
'rgba(120,80,220,0.85)',
'rgba(220,80,160,0.85)',
'rgba(200,150,255,0.85)',
'rgba(255,170,220,0.85)'
]
});

var categoriesOption = {
title: {
text: '文章分类统计图',
left: 'center',
top: 10,
textStyle: { color: color, fontSize: 18, fontWeight: 'bold' }
},
legend: {
bottom: 10,
data: ${categoryNameJson},
textStyle: { color: color, fontSize: 13 }
},
tooltip: {
trigger: 'item',
textStyle: { fontSize: 14 }
},
series: []
};
categoriesOption.series.push(
categoryParentFlag
? {
nodeClick: false,
name: '文章篇数',
type: 'sunburst',
radius: ['15%', '90%'],
center: ['50%', '52%'],
sort: 'desc',
data: ${categoryArrParentJson},
label: { color: color, fontSize: 13 },
itemStyle: {
borderColor: '#fff',
borderWidth: 2,
emphasis: {
focus: 'ancestor',
shadowBlur: 10,
shadowOffsetX: 0,
shadowColor: 'rgba(255, 255, 255, 0.5)'
}
}
}
: {
name: '文章篇数',
type: 'pie',
radius: [30, 80],
center: ['50%', '52%'],
roseType: 'area',
label: { color: color, fontSize: 13, formatter: '{b} : {c} ({d}%)' },
data: ${categoryArrJson},
itemStyle: {
borderColor: '#fff',
borderWidth: 2,
emphasis: {
shadowBlur: 10,
shadowOffsetX: 0,
shadowColor: 'rgba(255, 255, 255, 0.5)'
}
}
}
);
categoriesChart.setOption(categoriesOption);
window.addEventListener('resize', () => { categoriesChart.resize(); });
categoriesChart.on('click', 'series', (event) => {
if(event.data.path) window.location.href = '/' + event.data.path;
});
</script>`;
}
1
2
3
4
5
6
7
8
9
10
11
12
13
14
15
16
17
18
19
20
21
22
23
24
25
26
27
28
29
30
31
32
33
34
35
36
37
38
39
40
41
42
43
44
45
46
47
48
49
50
51
52
53
54
55
56
57
58
59
60
61
62
63
64
65
66
67
68
69
70
71
72
73
74
75
76
77
78
79
80
81
82
83
84
85
86
87
88
89
90
91
92
93
94
95
96
97
98
99
100
101
102
103
104
105
106
107
108
109
110
111
112
113
114
115
116
117
118
119
120
121
122
123
124
125
126
127
128
129
130
131
132
133
134
135
136
137
138
139
140
141
142
143
144
145
146
147
148
149
150
151
152
153
154
155
156
157
158
159
160
161
162
163
164
165
166
167
168
169
170
171
172
173
174
175
176
177
178
179
180
181
182
183
184
185
186
187
188
189
190
191
192
193
194
195
196
197
198
199
200
201
202
203
204
205
206
207
208
209
210
211
212
213
214
215
216
217
218
219
220
221
222
223
224
225
226
227
228
229
230
231
232
233
234
235
236
237
238
239
240
241
242
243
244
245
246
247
248
249
250
251
252
253
254
255
256
257
258
259
260
const cheerio = require("cheerio");
const moment = require("moment");

hexo.extend.filter.register(
"after_render:html",
function (locals) {
const $ = cheerio.load(locals);
const post = $("#posts-chart");
const tag = $("#tags-chart");
const category = $("#categories-chart");
const htmlEncode = false;

if (post.length > 0 || tag.length > 0 || category.length > 0) {
if (post.length > 0 && $("#postsChart").length === 0) {
if (post.attr("data-encode") === "true") htmlEncode = true;
post.after(postsChart(post.attr("data-start")));
}
if (tag.length > 0 && $("#tagsChart").length === 0) {
if (tag.attr("data-encode") === "true") htmlEncode = true;
tag.after(tagsChart(tag.attr("data-length")));
}
if (category.length > 0 && $("#categoriesChart").length === 0) {
if (category.attr("data-encode") === "true") htmlEncode = true;
category.after(categoriesChart(category.attr("data-parent")));
}

if (htmlEncode) {
return $.root()
.html()
.replace(/&amp;#/g, "&#");
} else {
return $.root().html();
}
} else {
return locals;
}
},
15,
);

function postsChart(startMonth) {
const startDate = moment(startMonth || "2020-01");
const endDate = moment();

const monthMap = new Map();
const dayTime = 3600 * 24 * 1000;
for (let time = startDate; time <= endDate; time += dayTime) {
const month = moment(time).format("YYYY-MM");
if (!monthMap.has(month)) monthMap.set(month, 0);
}
hexo.locals.get("posts").forEach(function (post) {
const month = post.date.format("YYYY-MM");
if (monthMap.has(month)) monthMap.set(month, monthMap.get(month) + 1);
});
const monthArr = JSON.stringify([...monthMap.keys()]);
const monthValueArr = JSON.stringify([...monthMap.values()]);

return `
<script id="postsChart">
var color = '#555555';
var postsChart = echarts.init(document.getElementById('posts-chart'), 'light');
var postsOption = {
title: {
text: '文章发布统计图',
left: 'center', top: 10,
textStyle: { color: color, fontSize: 18, fontWeight: 'bold' }
},
grid: { top: 70, bottom: 60, left: 60, right: 30 },
tooltip: { trigger: 'axis', textStyle: { fontSize: 14 } },
xAxis: {
name: '日期', type: 'category', boundaryGap: false,
nameTextStyle: { color: color, fontSize: 14 },
axisTick: { show: false }, axisLabel: { show: true, color: color, fontSize: 13 },
axisLine: { show: true, lineStyle: { color: color } },
data: ${monthArr}
},
yAxis: {
name: '文章篇数', type: 'value',
nameTextStyle: { color: color, fontSize: 14 }, splitLine: { show: false },
axisTick: { show: false }, axisLabel: { show: true, color: color, fontSize: 13 },
axisLine: { show: true, lineStyle: { color: color } }
},
series: [{
name: '文章篇数', type: 'line', smooth: true, lineStyle: { width: 0 }, showSymbol: false,
itemStyle: {
opacity: 1,
color: new echarts.graphic.LinearGradient(0, 0, 0, 1, [
{ offset: 0, color: 'rgba(255, 107, 53, 0.95)' },
{ offset: 1, color: 'rgba(255, 195, 0, 0.95)' }
])
},
areaStyle: {
opacity: 1,
color: new echarts.graphic.LinearGradient(0, 0, 0, 1, [
{ offset: 0, color: 'rgba(255, 107, 53, 0.55)' },
{ offset: 1, color: 'rgba(255, 195, 0, 0.25)' }
])
},
data: ${monthValueArr},
markLine: { data: [{ name: '平均值', type: 'average', label: { color: color, fontSize: 13 } }] }
}]
};
postsChart.setOption(postsOption);
window.addEventListener('resize', () => { postsChart.resize(); });
postsChart.on('click', 'series', (event) => {
if (event.componentType === 'series') window.location.href = '/archives/' + event.name.replace('-', '/');
});
</script>`;
}

function tagsChart(len) {
const tagArr = [];
hexo.locals.get("tags").map(function (tag) {
tagArr.push({ name: tag.name, value: tag.length, path: tag.path });
});
tagArr.sort((a, b) => b.value - a.value);
const dataLength = Math.min(tagArr.length, len) || tagArr.length;
const tagNameArr = [];
for (let i = 0; i < dataLength; i++) tagNameArr.push(tagArr[i].name);
const tagNameArrJson = JSON.stringify(tagNameArr);
const tagArrJson = JSON.stringify(tagArr);

return `
<script id="tagsChart">
var color = '#555555';
var tagsChart = echarts.init(document.getElementById('tags-chart'), 'light');
var tagsOption = {
title: {
text: 'Top ' + ${dataLength} + ' 标签统计图',
left: 'center', top: 10,
textStyle: { color: color, fontSize: 18, fontWeight: 'bold' }
},
grid: { top: 70, bottom: 60, left: 60, right: 30 },
tooltip: { textStyle: { fontSize: 14 } },
xAxis: {
name: '标签', type: 'category',
nameTextStyle: { color: color, fontSize: 14 }, axisTick: { show: false },
axisLabel: { show: true, color: color, interval: 0, rotate: 30, fontSize: 13 },
axisLine: { show: true, lineStyle: { color: color } },
data: ${tagNameArrJson}
},
yAxis: {
name: '文章篇数', type: 'value', splitLine: { show: false },
nameTextStyle: { color: color, fontSize: 14 }, axisTick: { show: false },
axisLabel: { show: true, color: color, fontSize: 13 },
axisLine: { show: true, lineStyle: { color: color } }
},
series: [{
name: '文章篇数', type: 'bar', data: ${tagArrJson},
itemStyle: {
borderRadius: [5, 5, 0, 0],
color: new echarts.graphic.LinearGradient(0, 0, 0, 1, [
{ offset: 0, color: 'rgba(255, 107, 53, 0.85)' },
{ offset: 1, color: 'rgba(255, 195, 0, 0.85)' }
])
},
emphasis: {
itemStyle: {
color: new echarts.graphic.LinearGradient(0, 0, 0, 1, [
{ offset: 0, color: 'rgba(255, 137, 83, 0.85)' },
{ offset: 1, color: 'rgba(255, 225, 30, 0.85)' }
])
}
},
markLine: { data: [{ name: '平均值', type: 'average', label: { color: color, fontSize: 13 } }] }
}]
};
tagsChart.setOption(tagsOption);
window.addEventListener('resize', () => { tagsChart.resize(); });
tagsChart.on('click', 'series', (event) => {
if(event.data.path) window.location.href = '/' + event.data.path;
});
</script>`;
}

function categoriesChart(dataParent) {
const categoryArr = [];
let categoryParentFlag = false;
hexo.locals.get("categories").map(function (category) {
if (category.parent) categoryParentFlag = true;
categoryArr.push({
name: category.name,
value: category.length,
path: category.path,
id: category._id,
parentId: category.parent || "0",
});
});
categoryParentFlag = categoryParentFlag && dataParent === "true";
categoryArr.sort((a, b) => b.value - a.value);

function translateListToTree(data, parent) {
let tree = [];
let temp;
data.forEach((item, index) => {
if (data[index].parentId == parent) {
let obj = data[index];
temp = translateListToTree(data, data[index].id);
if (temp.length > 0) obj.children = temp;
tree.push(obj);
}
});
return tree;
}

const categoryNameJson = JSON.stringify(categoryArr.map((c) => c.name));
const categoryArrJson = JSON.stringify(categoryArr);
const categoryArrParentJson = JSON.stringify(
translateListToTree(categoryArr, "0"),
);

return `
<script id="categoriesChart">
var color = '#555555';
var categoriesChart = echarts.init(document.getElementById('categories-chart'), 'light');
var categoryParentFlag = ${categoryParentFlag};

categoriesChart.setOption({
color: [
'rgba(255, 107, 53, 0.85)', 'rgba(255, 195, 0, 0.85)',
'rgba(235, 87, 33, 0.85)', 'rgba(235, 175, 0, 0.85)',
'rgba(255, 137, 83, 0.85)', 'rgba(255, 225, 30, 0.85)',
'rgba(215, 67, 13, 0.85)', 'rgba(215, 155, 0, 0.85)',
'rgba(255, 167, 113, 0.85)', 'rgba(255, 255, 60, 0.85)'
]
});

var categoriesOption = {
title: {
text: '文章分类统计图',
left: 'center', top: 10,
textStyle: { color: color, fontSize: 18, fontWeight: 'bold' }
},
legend: { bottom: 10, data: ${categoryNameJson}, textStyle: { color: color, fontSize: 13 } },
tooltip: { trigger: 'item', textStyle: { fontSize: 14 } },
series: []
};
categoriesOption.series.push(
categoryParentFlag
? {
nodeClick: false, name: '文章篇数', type: 'sunburst',
radius: ['15%', '90%'], center: ['50%', '52%'], sort: 'desc',
data: ${categoryArrParentJson},
label: { color: color, fontSize: 13 },
itemStyle: { borderColor: '#fff', borderWidth: 2, emphasis: { focus: 'ancestor', shadowBlur: 10, shadowOffsetX: 0, shadowColor: 'rgba(255,255,255,0.5)' } }
}
: {
name: '文章篇数', type: 'pie', radius: [30, 80], center: ['50%', '52%'], roseType: 'area',
label: { color: color, fontSize: 13, formatter: '{b} : {c} ({d}%)' },
data: ${categoryArrJson},
itemStyle: { borderColor: '#fff', borderWidth: 2, emphasis: { shadowBlur: 10, shadowOffsetX: 0, shadowColor: 'rgba(255,255,255,0.5)' } }
}
);
categoriesChart.setOption(categoriesOption);
window.addEventListener('resize', () => { categoriesChart.resize(); });
categoriesChart.on('click', 'series', (event) => {
if(event.data.path) window.location.href = '/' + event.data.path;
});
</script>`;
}
1
2
3
4
5
6
7
8
9
10
11
12
13
14
15
16
17
18
19
20
21
22
23
24
25
26
27
28
29
30
31
32
33
34
35
36
37
38
39
40
41
42
43
44
45
46
47
48
49
50
51
52
53
54
55
56
57
58
59
60
61
62
63
64
65
66
67
68
69
70
71
72
73
74
75
76
77
78
79
80
81
82
83
84
85
86
87
88
89
90
91
92
93
94
95
96
97
98
99
100
101
102
103
104
105
106
107
108
109
110
111
112
113
114
115
116
117
118
119
120
121
122
123
124
125
126
127
128
129
130
131
132
133
134
135
136
137
138
139
140
141
142
143
144
145
146
147
148
149
150
151
152
153
154
155
156
157
158
159
160
161
162
163
164
165
166
167
168
169
170
171
172
173
174
175
176
177
178
179
180
181
182
183
184
185
186
187
188
189
190
191
192
193
194
195
196
197
198
199
200
201
202
203
204
205
206
207
208
209
210
211
212
213
214
215
216
217
218
219
220
221
222
223
224
225
226
227
228
229
230
231
232
233
234
235
236
237
238
239
240
241
242
243
244
245
246
247
248
249
250
251
252
253
254
255
256
257
258
259
260
const cheerio = require("cheerio");
const moment = require("moment");

hexo.extend.filter.register(
"after_render:html",
function (locals) {
const $ = cheerio.load(locals);
const post = $("#posts-chart");
const tag = $("#tags-chart");
const category = $("#categories-chart");
const htmlEncode = false;

if (post.length > 0 || tag.length > 0 || category.length > 0) {
if (post.length > 0 && $("#postsChart").length === 0) {
if (post.attr("data-encode") === "true") htmlEncode = true;
post.after(postsChart(post.attr("data-start")));
}
if (tag.length > 0 && $("#tagsChart").length === 0) {
if (tag.attr("data-encode") === "true") htmlEncode = true;
tag.after(tagsChart(tag.attr("data-length")));
}
if (category.length > 0 && $("#categoriesChart").length === 0) {
if (category.attr("data-encode") === "true") htmlEncode = true;
category.after(categoriesChart(category.attr("data-parent")));
}

if (htmlEncode) {
return $.root()
.html()
.replace(/&amp;#/g, "&#");
} else {
return $.root().html();
}
} else {
return locals;
}
},
15,
);

function postsChart(startMonth) {
const startDate = moment(startMonth || "2020-01");
const endDate = moment();

const monthMap = new Map();
const dayTime = 3600 * 24 * 1000;
for (let time = startDate; time <= endDate; time += dayTime) {
const month = moment(time).format("YYYY-MM");
if (!monthMap.has(month)) monthMap.set(month, 0);
}
hexo.locals.get("posts").forEach(function (post) {
const month = post.date.format("YYYY-MM");
if (monthMap.has(month)) monthMap.set(month, monthMap.get(month) + 1);
});
const monthArr = JSON.stringify([...monthMap.keys()]);
const monthValueArr = JSON.stringify([...monthMap.values()]);

return `
<script id="postsChart">
var color = '#555555';
var postsChart = echarts.init(document.getElementById('posts-chart'), 'light');
var postsOption = {
title: {
text: '文章发布统计图',
left: 'center', top: 10,
textStyle: { color: color, fontSize: 18, fontWeight: 'bold' }
},
grid: { top: 70, bottom: 60, left: 60, right: 30 },
tooltip: { trigger: 'axis', textStyle: { fontSize: 14 } },
xAxis: {
name: '日期', type: 'category', boundaryGap: false,
nameTextStyle: { color: color, fontSize: 14 },
axisTick: { show: false }, axisLabel: { show: true, color: color, fontSize: 13 },
axisLine: { show: true, lineStyle: { color: color } },
data: ${monthArr}
},
yAxis: {
name: '文章篇数', type: 'value',
nameTextStyle: { color: color, fontSize: 14 }, splitLine: { show: false },
axisTick: { show: false }, axisLabel: { show: true, color: color, fontSize: 13 },
axisLine: { show: true, lineStyle: { color: color } }
},
series: [{
name: '文章篇数', type: 'line', smooth: true, lineStyle: { width: 0 }, showSymbol: false,
itemStyle: {
opacity: 1,
color: new echarts.graphic.LinearGradient(0, 0, 0, 1, [
{ offset: 0, color: 'rgba(0, 206, 201, 0.95)' },
{ offset: 1, color: 'rgba(3, 102, 214, 0.95)' }
])
},
areaStyle: {
opacity: 1,
color: new echarts.graphic.LinearGradient(0, 0, 0, 1, [
{ offset: 0, color: 'rgba(0, 206, 201, 0.55)' },
{ offset: 1, color: 'rgba(3, 102, 214, 0.25)' }
])
},
data: ${monthValueArr},
markLine: { data: [{ name: '平均值', type: 'average', label: { color: color, fontSize: 13 } }] }
}]
};
postsChart.setOption(postsOption);
window.addEventListener('resize', () => { postsChart.resize(); });
postsChart.on('click', 'series', (event) => {
if (event.componentType === 'series') window.location.href = '/archives/' + event.name.replace('-', '/');
});
</script>`;
}

function tagsChart(len) {
const tagArr = [];
hexo.locals.get("tags").map(function (tag) {
tagArr.push({ name: tag.name, value: tag.length, path: tag.path });
});
tagArr.sort((a, b) => b.value - a.value);
const dataLength = Math.min(tagArr.length, len) || tagArr.length;
const tagNameArr = [];
for (let i = 0; i < dataLength; i++) tagNameArr.push(tagArr[i].name);
const tagNameArrJson = JSON.stringify(tagNameArr);
const tagArrJson = JSON.stringify(tagArr);

return `
<script id="tagsChart">
var color = '#555555';
var tagsChart = echarts.init(document.getElementById('tags-chart'), 'light');
var tagsOption = {
title: {
text: 'Top ' + ${dataLength} + ' 标签统计图',
left: 'center', top: 10,
textStyle: { color: color, fontSize: 18, fontWeight: 'bold' }
},
grid: { top: 70, bottom: 60, left: 60, right: 30 },
tooltip: { textStyle: { fontSize: 14 } },
xAxis: {
name: '标签', type: 'category',
nameTextStyle: { color: color, fontSize: 14 }, axisTick: { show: false },
axisLabel: { show: true, color: color, interval: 0, rotate: 30, fontSize: 13 },
axisLine: { show: true, lineStyle: { color: color } },
data: ${tagNameArrJson}
},
yAxis: {
name: '文章篇数', type: 'value', splitLine: { show: false },
nameTextStyle: { color: color, fontSize: 14 }, axisTick: { show: false },
axisLabel: { show: true, color: color, fontSize: 13 },
axisLine: { show: true, lineStyle: { color: color } }
},
series: [{
name: '文章篇数', type: 'bar', data: ${tagArrJson},
itemStyle: {
borderRadius: [5, 5, 0, 0],
color: new echarts.graphic.LinearGradient(0, 0, 0, 1, [
{ offset: 0, color: 'rgba(0, 206, 201, 0.85)' },
{ offset: 1, color: 'rgba(3, 102, 214, 0.85)' }
])
},
emphasis: {
itemStyle: {
color: new echarts.graphic.LinearGradient(0, 0, 0, 1, [
{ offset: 0, color: 'rgba(30, 226, 221, 0.85)' },
{ offset: 1, color: 'rgba(33, 132, 244, 0.85)' }
])
}
},
markLine: { data: [{ name: '平均值', type: 'average', label: { color: color, fontSize: 13 } }] }
}]
};
tagsChart.setOption(tagsOption);
window.addEventListener('resize', () => { tagsChart.resize(); });
tagsChart.on('click', 'series', (event) => {
if(event.data.path) window.location.href = '/' + event.data.path;
});
</script>`;
}

function categoriesChart(dataParent) {
const categoryArr = [];
let categoryParentFlag = false;
hexo.locals.get("categories").map(function (category) {
if (category.parent) categoryParentFlag = true;
categoryArr.push({
name: category.name,
value: category.length,
path: category.path,
id: category._id,
parentId: category.parent || "0",
});
});
categoryParentFlag = categoryParentFlag && dataParent === "true";
categoryArr.sort((a, b) => b.value - a.value);

function translateListToTree(data, parent) {
let tree = [];
let temp;
data.forEach((item, index) => {
if (data[index].parentId == parent) {
let obj = data[index];
temp = translateListToTree(data, data[index].id);
if (temp.length > 0) obj.children = temp;
tree.push(obj);
}
});
return tree;
}

const categoryNameJson = JSON.stringify(categoryArr.map((c) => c.name));
const categoryArrJson = JSON.stringify(categoryArr);
const categoryArrParentJson = JSON.stringify(
translateListToTree(categoryArr, "0"),
);

return `
<script id="categoriesChart">
var color = '#555555';
var categoriesChart = echarts.init(document.getElementById('categories-chart'), 'light');
var categoryParentFlag = ${categoryParentFlag};

categoriesChart.setOption({
color: [
'rgba(0, 206, 201, 0.85)', 'rgba(3, 102, 214, 0.85)',
'rgba(0, 166, 156, 0.85)', 'rgba(0, 82, 180, 0.85)',
'rgba(40, 226, 221, 0.85)', 'rgba(43, 132, 244, 0.85)',
'rgba(0, 146, 141, 0.85)', 'rgba(0, 62, 140, 0.85)',
'rgba(70, 246, 241, 0.85)', 'rgba(73, 162, 255, 0.85)'
]
});

var categoriesOption = {
title: {
text: '文章分类统计图',
left: 'center', top: 10,
textStyle: { color: color, fontSize: 18, fontWeight: 'bold' }
},
legend: { bottom: 10, data: ${categoryNameJson}, textStyle: { color: color, fontSize: 13 } },
tooltip: { trigger: 'item', textStyle: { fontSize: 14 } },
series: []
};
categoriesOption.series.push(
categoryParentFlag
? {
nodeClick: false, name: '文章篇数', type: 'sunburst',
radius: ['15%', '90%'], center: ['50%', '52%'], sort: 'desc',
data: ${categoryArrParentJson},
label: { color: color, fontSize: 13 },
itemStyle: { borderColor: '#fff', borderWidth: 2, emphasis: { focus: 'ancestor', shadowBlur: 10, shadowOffsetX: 0, shadowColor: 'rgba(255,255,255,0.5)' } }
}
: {
name: '文章篇数', type: 'pie', radius: [30, 80], center: ['50%', '52%'], roseType: 'area',
label: { color: color, fontSize: 13, formatter: '{b} : {c} ({d}%)' },
data: ${categoryArrJson},
itemStyle: { borderColor: '#fff', borderWidth: 2, emphasis: { shadowBlur: 10, shadowOffsetX: 0, shadowColor: 'rgba(255,255,255,0.5)' } }
}
);
categoriesChart.setOption(categoriesOption);
window.addEventListener('resize', () => { categoriesChart.resize(); });
categoriesChart.on('click', 'series', (event) => {
if(event.data.path) window.location.href = '/' + event.data.path;
});
</script>`;
}
1
2
3
4
5
6
7
8
9
10
11
12
13
14
15
16
17
18
19
20
21
22
23
24
25
26
27
28
29
30
31
32
33
34
35
36
37
38
39
40
41
42
43
44
45
46
47
48
49
50
51
52
53
54
55
56
57
58
59
60
61
62
63
64
65
66
67
68
69
70
71
72
73
74
75
76
77
78
79
80
81
82
83
84
85
86
87
88
89
90
91
92
93
94
95
96
97
98
99
100
101
102
103
104
105
106
107
108
109
110
111
112
113
114
115
116
117
118
119
120
121
122
123
124
125
126
127
128
129
130
131
132
133
134
135
136
137
138
139
140
141
142
143
144
145
146
147
148
149
150
151
152
153
154
155
156
157
158
159
160
161
162
163
164
165
166
167
168
169
170
171
172
173
174
175
176
177
178
179
180
181
182
183
184
185
186
187
188
189
190
191
192
193
194
195
196
197
198
199
200
201
202
203
204
205
206
207
208
209
210
211
212
213
214
215
216
217
218
219
220
221
222
223
224
225
226
227
228
229
230
231
232
233
234
235
236
237
238
239
240
241
242
243
244
245
246
247
248
249
250
251
252
253
254
255
256
257
258
259
260
const cheerio = require("cheerio");
const moment = require("moment");

hexo.extend.filter.register(
"after_render:html",
function (locals) {
const $ = cheerio.load(locals);
const post = $("#posts-chart");
const tag = $("#tags-chart");
const category = $("#categories-chart");
const htmlEncode = false;

if (post.length > 0 || tag.length > 0 || category.length > 0) {
if (post.length > 0 && $("#postsChart").length === 0) {
if (post.attr("data-encode") === "true") htmlEncode = true;
post.after(postsChart(post.attr("data-start")));
}
if (tag.length > 0 && $("#tagsChart").length === 0) {
if (tag.attr("data-encode") === "true") htmlEncode = true;
tag.after(tagsChart(tag.attr("data-length")));
}
if (category.length > 0 && $("#categoriesChart").length === 0) {
if (category.attr("data-encode") === "true") htmlEncode = true;
category.after(categoriesChart(category.attr("data-parent")));
}

if (htmlEncode) {
return $.root()
.html()
.replace(/&amp;#/g, "&#");
} else {
return $.root().html();
}
} else {
return locals;
}
},
15,
);

function postsChart(startMonth) {
const startDate = moment(startMonth || "2020-01");
const endDate = moment();

const monthMap = new Map();
const dayTime = 3600 * 24 * 1000;
for (let time = startDate; time <= endDate; time += dayTime) {
const month = moment(time).format("YYYY-MM");
if (!monthMap.has(month)) monthMap.set(month, 0);
}
hexo.locals.get("posts").forEach(function (post) {
const month = post.date.format("YYYY-MM");
if (monthMap.has(month)) monthMap.set(month, monthMap.get(month) + 1);
});
const monthArr = JSON.stringify([...monthMap.keys()]);
const monthValueArr = JSON.stringify([...monthMap.values()]);

return `
<script id="postsChart">
var color = '#555555';
var postsChart = echarts.init(document.getElementById('posts-chart'), 'light');
var postsOption = {
title: {
text: '文章发布统计图',
left: 'center', top: 10,
textStyle: { color: color, fontSize: 18, fontWeight: 'bold' }
},
grid: { top: 70, bottom: 60, left: 60, right: 30 },
tooltip: { trigger: 'axis', textStyle: { fontSize: 14 } },
xAxis: {
name: '日期', type: 'category', boundaryGap: false,
nameTextStyle: { color: color, fontSize: 14 },
axisTick: { show: false }, axisLabel: { show: true, color: color, fontSize: 13 },
axisLine: { show: true, lineStyle: { color: color } },
data: ${monthArr}
},
yAxis: {
name: '文章篇数', type: 'value',
nameTextStyle: { color: color, fontSize: 14 }, splitLine: { show: false },
axisTick: { show: false }, axisLabel: { show: true, color: color, fontSize: 13 },
axisLine: { show: true, lineStyle: { color: color } }
},
series: [{
name: '文章篇数', type: 'line', smooth: true, lineStyle: { width: 0 }, showSymbol: false,
itemStyle: {
opacity: 1,
color: new echarts.graphic.LinearGradient(0, 0, 0, 1, [
{ offset: 0, color: 'rgba(0, 168, 107, 0.95)' },
{ offset: 1, color: 'rgba(57, 255, 186, 0.95)' }
])
},
areaStyle: {
opacity: 1,
color: new echarts.graphic.LinearGradient(0, 0, 0, 1, [
{ offset: 0, color: 'rgba(0, 168, 107, 0.55)' },
{ offset: 1, color: 'rgba(57, 255, 186, 0.25)' }
])
},
data: ${monthValueArr},
markLine: { data: [{ name: '平均值', type: 'average', label: { color: color, fontSize: 13 } }] }
}]
};
postsChart.setOption(postsOption);
window.addEventListener('resize', () => { postsChart.resize(); });
postsChart.on('click', 'series', (event) => {
if (event.componentType === 'series') window.location.href = '/archives/' + event.name.replace('-', '/');
});
</script>`;
}

function tagsChart(len) {
const tagArr = [];
hexo.locals.get("tags").map(function (tag) {
tagArr.push({ name: tag.name, value: tag.length, path: tag.path });
});
tagArr.sort((a, b) => b.value - a.value);
const dataLength = Math.min(tagArr.length, len) || tagArr.length;
const tagNameArr = [];
for (let i = 0; i < dataLength; i++) tagNameArr.push(tagArr[i].name);
const tagNameArrJson = JSON.stringify(tagNameArr);
const tagArrJson = JSON.stringify(tagArr);

return `
<script id="tagsChart">
var color = '#555555';
var tagsChart = echarts.init(document.getElementById('tags-chart'), 'light');
var tagsOption = {
title: {
text: 'Top ' + ${dataLength} + ' 标签统计图',
left: 'center', top: 10,
textStyle: { color: color, fontSize: 18, fontWeight: 'bold' }
},
grid: { top: 70, bottom: 60, left: 60, right: 30 },
tooltip: { textStyle: { fontSize: 14 } },
xAxis: {
name: '标签', type: 'category',
nameTextStyle: { color: color, fontSize: 14 }, axisTick: { show: false },
axisLabel: { show: true, color: color, interval: 0, rotate: 30, fontSize: 13 },
axisLine: { show: true, lineStyle: { color: color } },
data: ${tagNameArrJson}
},
yAxis: {
name: '文章篇数', type: 'value', splitLine: { show: false },
nameTextStyle: { color: color, fontSize: 14 }, axisTick: { show: false },
axisLabel: { show: true, color: color, fontSize: 13 },
axisLine: { show: true, lineStyle: { color: color } }
},
series: [{
name: '文章篇数', type: 'bar', data: ${tagArrJson},
itemStyle: {
borderRadius: [5, 5, 0, 0],
color: new echarts.graphic.LinearGradient(0, 0, 0, 1, [
{ offset: 0, color: 'rgba(0, 168, 107, 0.85)' },
{ offset: 1, color: 'rgba(57, 255, 186, 0.85)' }
])
},
emphasis: {
itemStyle: {
color: new echarts.graphic.LinearGradient(0, 0, 0, 1, [
{ offset: 0, color: 'rgba(30, 198, 137, 0.85)' },
{ offset: 1, color: 'rgba(87, 255, 216, 0.85)' }
])
}
},
markLine: { data: [{ name: '平均值', type: 'average', label: { color: color, fontSize: 13 } }] }
}]
};
tagsChart.setOption(tagsOption);
window.addEventListener('resize', () => { tagsChart.resize(); });
tagsChart.on('click', 'series', (event) => {
if(event.data.path) window.location.href = '/' + event.data.path;
});
</script>`;
}

function categoriesChart(dataParent) {
const categoryArr = [];
let categoryParentFlag = false;
hexo.locals.get("categories").map(function (category) {
if (category.parent) categoryParentFlag = true;
categoryArr.push({
name: category.name,
value: category.length,
path: category.path,
id: category._id,
parentId: category.parent || "0",
});
});
categoryParentFlag = categoryParentFlag && dataParent === "true";
categoryArr.sort((a, b) => b.value - a.value);

function translateListToTree(data, parent) {
let tree = [];
let temp;
data.forEach((item, index) => {
if (data[index].parentId == parent) {
let obj = data[index];
temp = translateListToTree(data, data[index].id);
if (temp.length > 0) obj.children = temp;
tree.push(obj);
}
});
return tree;
}

const categoryNameJson = JSON.stringify(categoryArr.map((c) => c.name));
const categoryArrJson = JSON.stringify(categoryArr);
const categoryArrParentJson = JSON.stringify(
translateListToTree(categoryArr, "0"),
);

return `
<script id="categoriesChart">
var color = '#555555';
var categoriesChart = echarts.init(document.getElementById('categories-chart'), 'light');
var categoryParentFlag = ${categoryParentFlag};

categoriesChart.setOption({
color: [
'rgba(0, 168, 107, 0.85)', 'rgba(57, 255, 186, 0.85)',
'rgba(0, 138, 87, 0.85)', 'rgba(37, 225, 156, 0.85)',
'rgba(30, 198, 137, 0.85)', 'rgba(87, 255, 216, 0.85)',
'rgba(0, 108, 67, 0.85)', 'rgba(17, 195, 126, 0.85)',
'rgba(50, 228, 167, 0.85)', 'rgba(107, 255, 236, 0.85)'
]
});

var categoriesOption = {
title: {
text: '文章分类统计图',
left: 'center', top: 10,
textStyle: { color: color, fontSize: 18, fontWeight: 'bold' }
},
legend: { bottom: 10, data: ${categoryNameJson}, textStyle: { color: color, fontSize: 13 } },
tooltip: { trigger: 'item', textStyle: { fontSize: 14 } },
series: []
};
categoriesOption.series.push(
categoryParentFlag
? {
nodeClick: false, name: '文章篇数', type: 'sunburst',
radius: ['15%', '90%'], center: ['50%', '52%'], sort: 'desc',
data: ${categoryArrParentJson},
label: { color: color, fontSize: 13 },
itemStyle: { borderColor: '#fff', borderWidth: 2, emphasis: { focus: 'ancestor', shadowBlur: 10, shadowOffsetX: 0, shadowColor: 'rgba(255,255,255,0.5)' } }
}
: {
name: '文章篇数', type: 'pie', radius: [30, 80], center: ['50%', '52%'], roseType: 'area',
label: { color: color, fontSize: 13, formatter: '{b} : {c} ({d}%)' },
data: ${categoryArrJson},
itemStyle: { borderColor: '#fff', borderWidth: 2, emphasis: { shadowBlur: 10, shadowOffsetX: 0, shadowColor: 'rgba(255,255,255,0.5)' } }
}
);
categoriesChart.setOption(categoriesOption);
window.addEventListener('resize', () => { categoriesChart.resize(); });
categoriesChart.on('click', 'series', (event) => {
if(event.data.path) window.location.href = '/' + event.data.path;
});
</script>`;
}
1
2
3
4
5
6
7
8
9
10
11
12
13
14
15
16
17
18
19
20
21
22
23
24
25
26
27
28
29
30
31
32
33
34
35
36
37
38
39
40
41
42
43
44
45
46
47
48
49
50
51
52
53
54
55
56
57
58
59
60
61
62
63
64
65
66
67
68
69
70
71
72
73
74
75
76
77
78
79
80
81
82
83
84
85
86
87
88
89
90
91
92
93
94
95
96
97
98
99
100
101
102
103
104
105
106
107
108
109
110
111
112
113
114
115
116
117
118
119
120
121
122
123
124
125
126
127
128
129
130
131
132
133
134
135
136
137
138
139
140
141
142
143
144
145
146
147
148
149
150
151
152
153
154
155
156
157
158
159
160
161
162
163
164
165
166
167
168
169
170
171
172
173
174
175
176
177
178
179
180
181
182
183
184
185
186
187
188
189
190
191
192
193
194
195
196
197
198
199
200
201
202
203
204
205
206
207
208
209
210
211
212
213
214
215
216
217
218
219
220
221
222
223
224
225
226
227
228
229
230
231
232
233
234
235
236
237
238
239
240
241
242
243
244
245
246
247
248
249
250
251
252
253
254
255
256
257
258
259
260
const cheerio = require("cheerio");
const moment = require("moment");

hexo.extend.filter.register(
"after_render:html",
function (locals) {
const $ = cheerio.load(locals);
const post = $("#posts-chart");
const tag = $("#tags-chart");
const category = $("#categories-chart");
const htmlEncode = false;

if (post.length > 0 || tag.length > 0 || category.length > 0) {
if (post.length > 0 && $("#postsChart").length === 0) {
if (post.attr("data-encode") === "true") htmlEncode = true;
post.after(postsChart(post.attr("data-start")));
}
if (tag.length > 0 && $("#tagsChart").length === 0) {
if (tag.attr("data-encode") === "true") htmlEncode = true;
tag.after(tagsChart(tag.attr("data-length")));
}
if (category.length > 0 && $("#categoriesChart").length === 0) {
if (category.attr("data-encode") === "true") htmlEncode = true;
category.after(categoriesChart(category.attr("data-parent")));
}

if (htmlEncode) {
return $.root()
.html()
.replace(/&amp;#/g, "&#");
} else {
return $.root().html();
}
} else {
return locals;
}
},
15,
);

function postsChart(startMonth) {
const startDate = moment(startMonth || "2020-01");
const endDate = moment();

const monthMap = new Map();
const dayTime = 3600 * 24 * 1000;
for (let time = startDate; time <= endDate; time += dayTime) {
const month = moment(time).format("YYYY-MM");
if (!monthMap.has(month)) monthMap.set(month, 0);
}
hexo.locals.get("posts").forEach(function (post) {
const month = post.date.format("YYYY-MM");
if (monthMap.has(month)) monthMap.set(month, monthMap.get(month) + 1);
});
const monthArr = JSON.stringify([...monthMap.keys()]);
const monthValueArr = JSON.stringify([...monthMap.values()]);

return `
<script id="postsChart">
var color = '#555555';
var postsChart = echarts.init(document.getElementById('posts-chart'), 'light');
var postsOption = {
title: {
text: '文章发布统计图',
left: 'center', top: 10,
textStyle: { color: color, fontSize: 18, fontWeight: 'bold' }
},
grid: { top: 70, bottom: 60, left: 60, right: 30 },
tooltip: { trigger: 'axis', textStyle: { fontSize: 14 } },
xAxis: {
name: '日期', type: 'category', boundaryGap: false,
nameTextStyle: { color: color, fontSize: 14 },
axisTick: { show: false }, axisLabel: { show: true, color: color, fontSize: 13 },
axisLine: { show: true, lineStyle: { color: color } },
data: ${monthArr}
},
yAxis: {
name: '文章篇数', type: 'value',
nameTextStyle: { color: color, fontSize: 14 }, splitLine: { show: false },
axisTick: { show: false }, axisLabel: { show: true, color: color, fontSize: 13 },
axisLine: { show: true, lineStyle: { color: color } }
},
series: [{
name: '文章篇数', type: 'line', smooth: true, lineStyle: { width: 0 }, showSymbol: false,
itemStyle: {
opacity: 1,
color: new echarts.graphic.LinearGradient(0, 0, 0, 1, [
{ offset: 0, color: 'rgba(220, 20, 60, 0.95)' },
{ offset: 1, color: 'rgba(139, 0, 69, 0.95)' }
])
},
areaStyle: {
opacity: 1,
color: new echarts.graphic.LinearGradient(0, 0, 0, 1, [
{ offset: 0, color: 'rgba(220, 20, 60, 0.55)' },
{ offset: 1, color: 'rgba(139, 0, 69, 0.25)' }
])
},
data: ${monthValueArr},
markLine: { data: [{ name: '平均值', type: 'average', label: { color: color, fontSize: 13 } }] }
}]
};
postsChart.setOption(postsOption);
window.addEventListener('resize', () => { postsChart.resize(); });
postsChart.on('click', 'series', (event) => {
if (event.componentType === 'series') window.location.href = '/archives/' + event.name.replace('-', '/');
});
</script>`;
}

function tagsChart(len) {
const tagArr = [];
hexo.locals.get("tags").map(function (tag) {
tagArr.push({ name: tag.name, value: tag.length, path: tag.path });
});
tagArr.sort((a, b) => b.value - a.value);
const dataLength = Math.min(tagArr.length, len) || tagArr.length;
const tagNameArr = [];
for (let i = 0; i < dataLength; i++) tagNameArr.push(tagArr[i].name);
const tagNameArrJson = JSON.stringify(tagNameArr);
const tagArrJson = JSON.stringify(tagArr);

return `
<script id="tagsChart">
var color = '#555555';
var tagsChart = echarts.init(document.getElementById('tags-chart'), 'light');
var tagsOption = {
title: {
text: 'Top ' + ${dataLength} + ' 标签统计图',
left: 'center', top: 10,
textStyle: { color: color, fontSize: 18, fontWeight: 'bold' }
},
grid: { top: 70, bottom: 60, left: 60, right: 30 },
tooltip: { textStyle: { fontSize: 14 } },
xAxis: {
name: '标签', type: 'category',
nameTextStyle: { color: color, fontSize: 14 }, axisTick: { show: false },
axisLabel: { show: true, color: color, interval: 0, rotate: 30, fontSize: 13 },
axisLine: { show: true, lineStyle: { color: color } },
data: ${tagNameArrJson}
},
yAxis: {
name: '文章篇数', type: 'value', splitLine: { show: false },
nameTextStyle: { color: color, fontSize: 14 }, axisTick: { show: false },
axisLabel: { show: true, color: color, fontSize: 13 },
axisLine: { show: true, lineStyle: { color: color } }
},
series: [{
name: '文章篇数', type: 'bar', data: ${tagArrJson},
itemStyle: {
borderRadius: [5, 5, 0, 0],
color: new echarts.graphic.LinearGradient(0, 0, 0, 1, [
{ offset: 0, color: 'rgba(220, 20, 60, 0.85)' },
{ offset: 1, color: 'rgba(139, 0, 69, 0.85)' }
])
},
emphasis: {
itemStyle: {
color: new echarts.graphic.LinearGradient(0, 0, 0, 1, [
{ offset: 0, color: 'rgba(250, 50, 90, 0.85)' },
{ offset: 1, color: 'rgba(169, 30, 99, 0.85)' }
])
}
},
markLine: { data: [{ name: '平均值', type: 'average', label: { color: color, fontSize: 13 } }] }
}]
};
tagsChart.setOption(tagsOption);
window.addEventListener('resize', () => { tagsChart.resize(); });
tagsChart.on('click', 'series', (event) => {
if(event.data.path) window.location.href = '/' + event.data.path;
});
</script>`;
}

function categoriesChart(dataParent) {
const categoryArr = [];
let categoryParentFlag = false;
hexo.locals.get("categories").map(function (category) {
if (category.parent) categoryParentFlag = true;
categoryArr.push({
name: category.name,
value: category.length,
path: category.path,
id: category._id,
parentId: category.parent || "0",
});
});
categoryParentFlag = categoryParentFlag && dataParent === "true";
categoryArr.sort((a, b) => b.value - a.value);

function translateListToTree(data, parent) {
let tree = [];
let temp;
data.forEach((item, index) => {
if (data[index].parentId == parent) {
let obj = data[index];
temp = translateListToTree(data, data[index].id);
if (temp.length > 0) obj.children = temp;
tree.push(obj);
}
});
return tree;
}

const categoryNameJson = JSON.stringify(categoryArr.map((c) => c.name));
const categoryArrJson = JSON.stringify(categoryArr);
const categoryArrParentJson = JSON.stringify(
translateListToTree(categoryArr, "0"),
);

return `
<script id="categoriesChart">
var color = '#555555';
var categoriesChart = echarts.init(document.getElementById('categories-chart'), 'light');
var categoryParentFlag = ${categoryParentFlag};

categoriesChart.setOption({
color: [
'rgba(220, 20, 60, 0.85)', 'rgba(139, 0, 69, 0.85)',
'rgba(190, 0, 40, 0.85)', 'rgba(109, 0, 49, 0.85)',
'rgba(250, 50, 90, 0.85)', 'rgba(169, 30, 99, 0.85)',
'rgba(160, 0, 30, 0.85)', 'rgba(89, 0, 29, 0.85)',
'rgba(255, 80, 110, 0.85)', 'rgba(199, 50, 119, 0.85)'
]
});

var categoriesOption = {
title: {
text: '文章分类统计图',
left: 'center', top: 10,
textStyle: { color: color, fontSize: 18, fontWeight: 'bold' }
},
legend: { bottom: 10, data: ${categoryNameJson}, textStyle: { color: color, fontSize: 13 } },
tooltip: { trigger: 'item', textStyle: { fontSize: 14 } },
series: []
};
categoriesOption.series.push(
categoryParentFlag
? {
nodeClick: false, name: '文章篇数', type: 'sunburst',
radius: ['15%', '90%'], center: ['50%', '52%'], sort: 'desc',
data: ${categoryArrParentJson},
label: { color: color, fontSize: 13 },
itemStyle: { borderColor: '#fff', borderWidth: 2, emphasis: { focus: 'ancestor', shadowBlur: 10, shadowOffsetX: 0, shadowColor: 'rgba(255,255,255,0.5)' } }
}
: {
name: '文章篇数', type: 'pie', radius: [30, 80], center: ['50%', '52%'], roseType: 'area',
label: { color: color, fontSize: 13, formatter: '{b} : {c} ({d}%)' },
data: ${categoryArrJson},
itemStyle: { borderColor: '#fff', borderWidth: 2, emphasis: { shadowBlur: 10, shadowOffsetX: 0, shadowColor: 'rgba(255,255,255,0.5)' } }
}
);
categoriesChart.setOption(categoriesOption);
window.addEventListener('resize', () => { categoriesChart.resize(); });
categoriesChart.on('click', 'series', (event) => {
if(event.data.path) window.location.href = '/' + event.data.path;
});
</script>`;
}

使用 ECharts 图表

生成 status 文件

  • 在 hexo 工作目录下运行代码,生成 source\status\index.md 文件
1
hexo new page status

编辑 Status 文件

  • 在 source\status\index.md 中添加以下 HTML 代码块
1
2
3
4
5
6
<!-- 文章发布时间统计图 -->
<div id="posts-chart" data-start="2023-10" style="border-radius: 8px; height: 300px; padding: 10px; width: 100%;"></div>
<!-- 文章标签统计图 -->
<div id="tags-chart" data-length="10" style="border-radius: 8px; height: 300px; padding: 10px; width: 100%;"></div>
<!-- 文章分类统计图 -->
<div id="categories-chart" style="border-radius: 8px; height: 300px; padding: 10px; width: 100%;"></div>

将 status 页面加入 Butterfly 导航栏

  • 编辑 _config.butterfly.yml 或 themes\butterfly\_config.yml 中配置项
1
2
3
4
menu:
首页: /#content-inner || fas fa-home
# 省略...
站点状态: /status/ || fas fa-chart-pie

生成 status 页面并预览 status

生成 status 页面

  • 在 hexo 工作目录下运行代码
1
2
3
4
# 生成并预览
hexo clean && hexo server
# 或者
hexo clean; hexo server

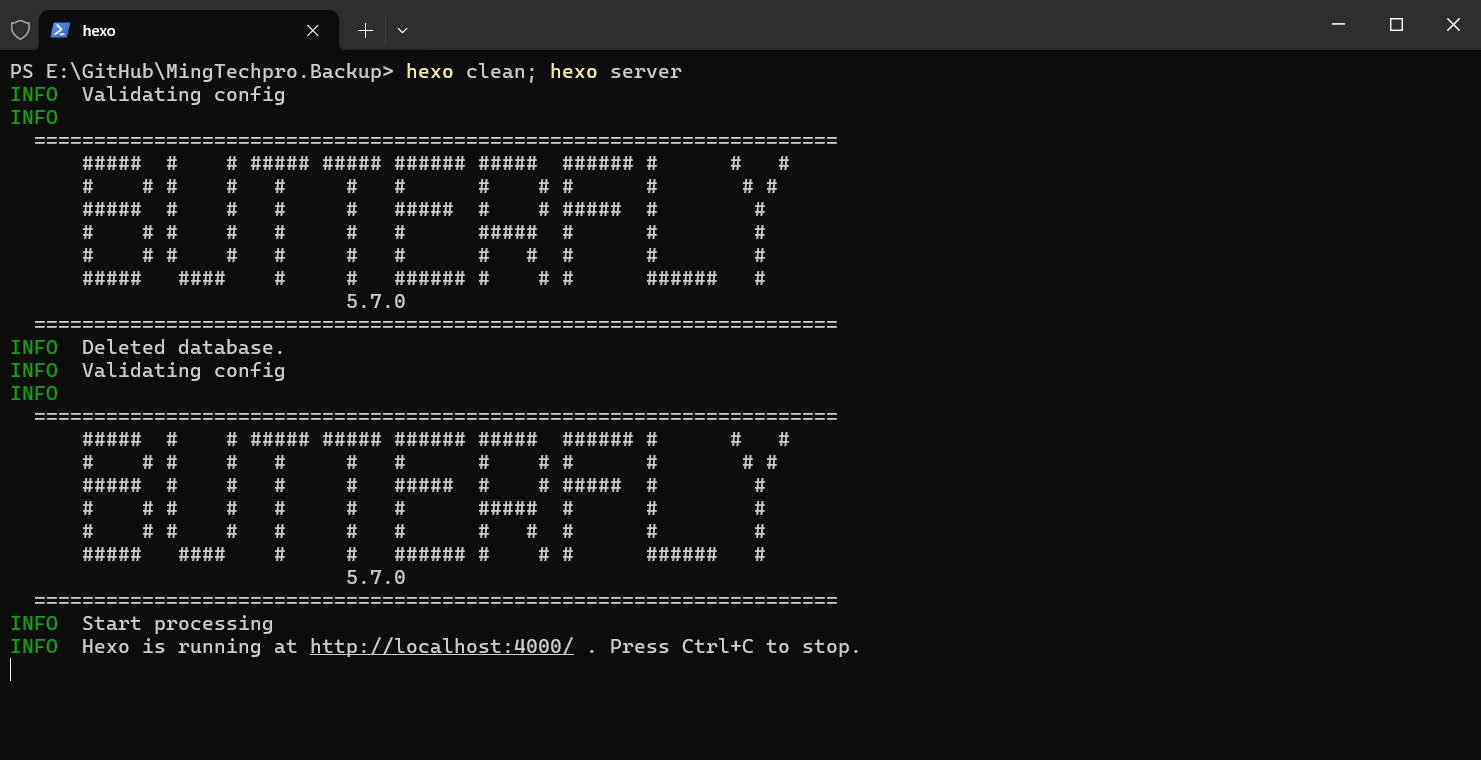
生成status页面

预览 status 页面

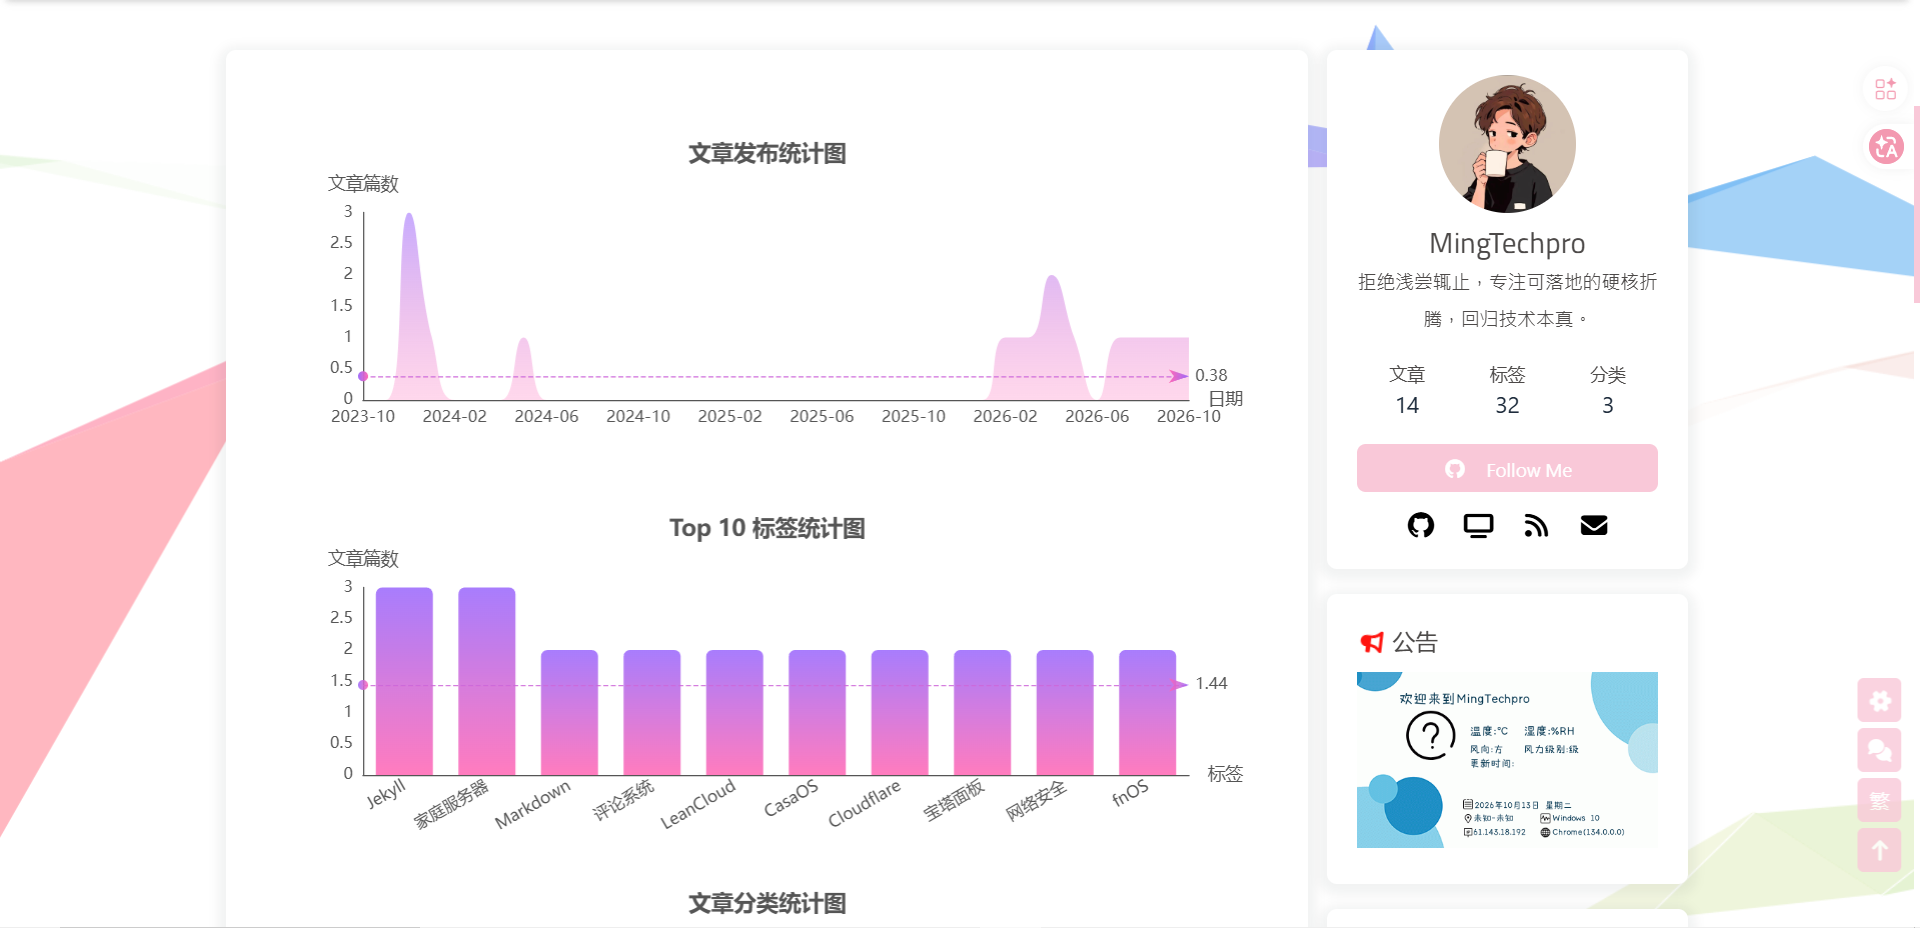
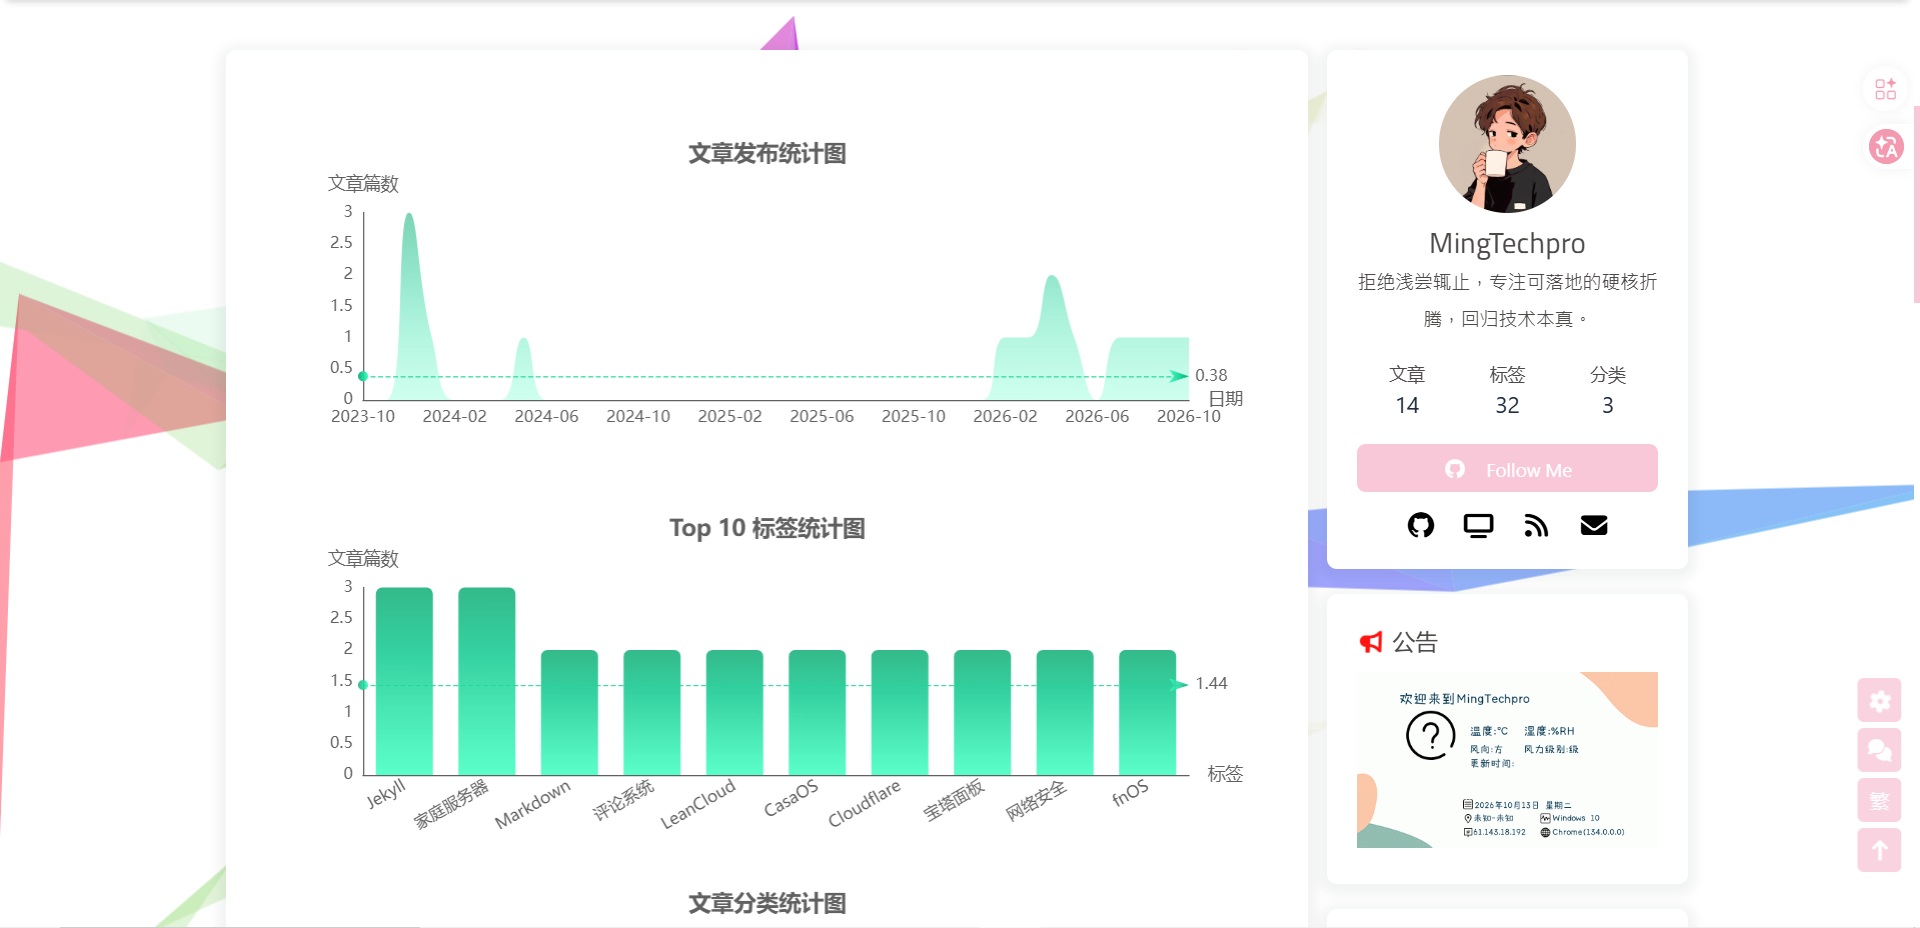
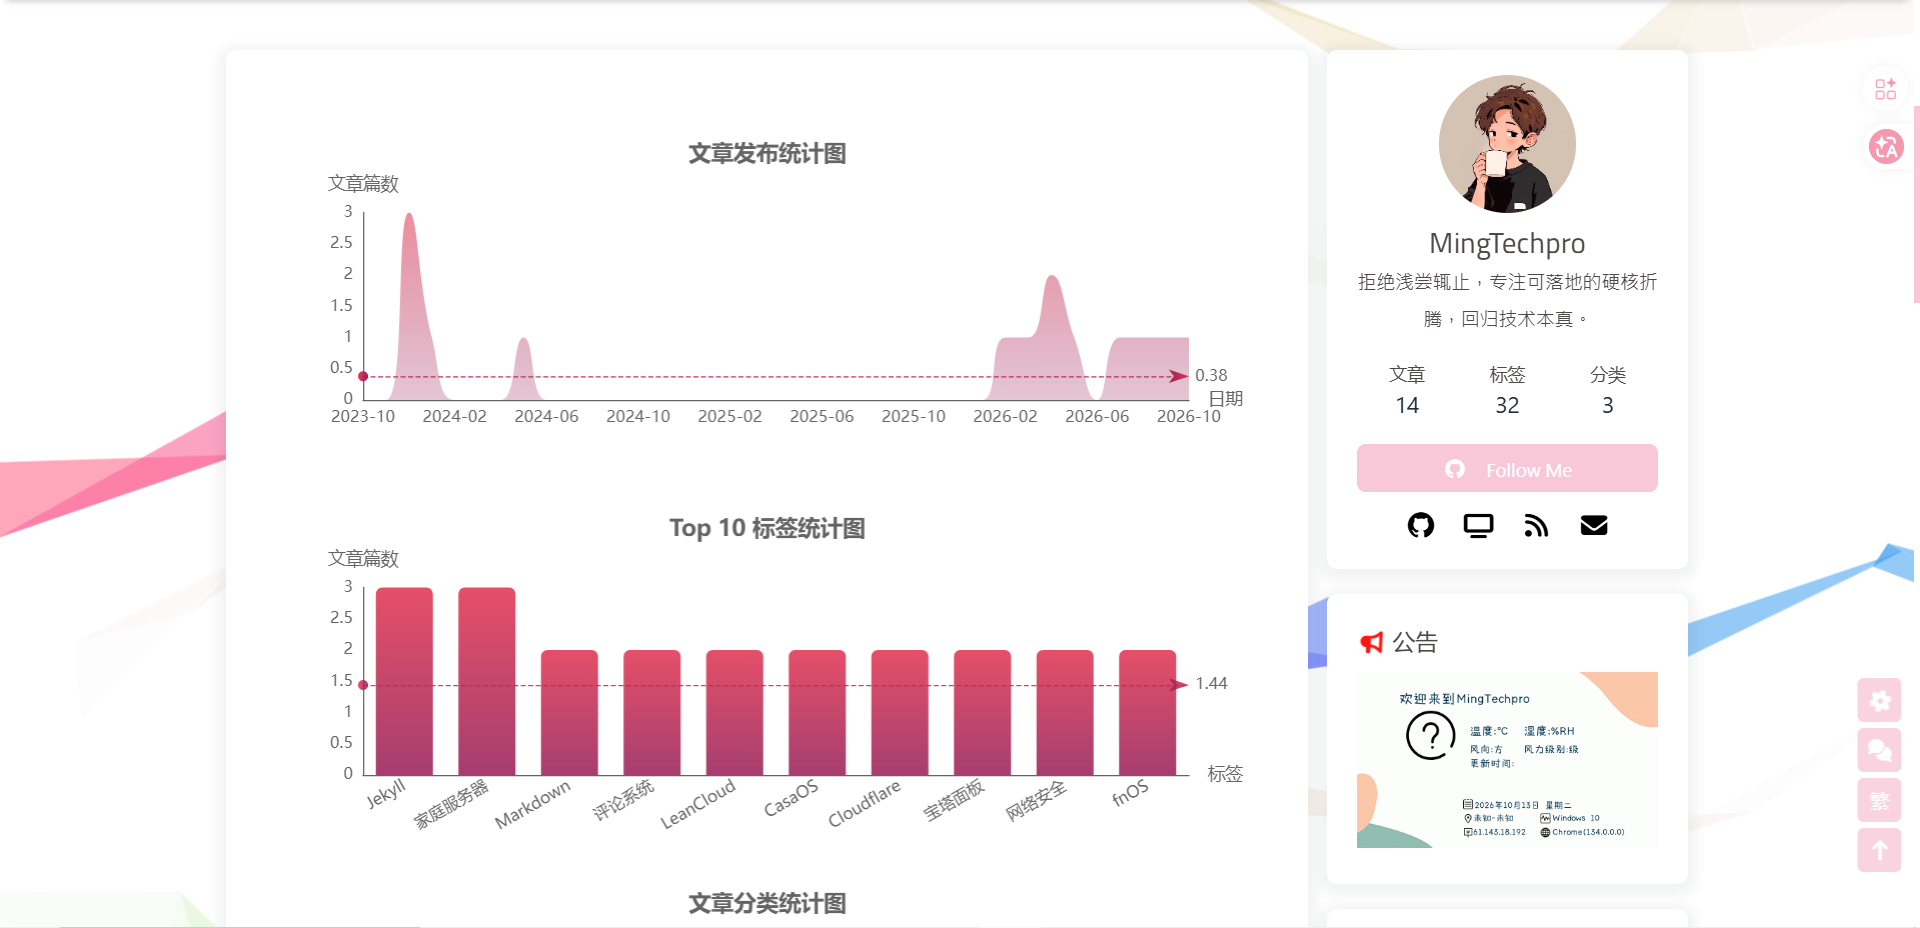
页面发布后,你将看到一个可交互的折线图,支持悬停提示、缩放与窗口自适应。

紫粉渐变

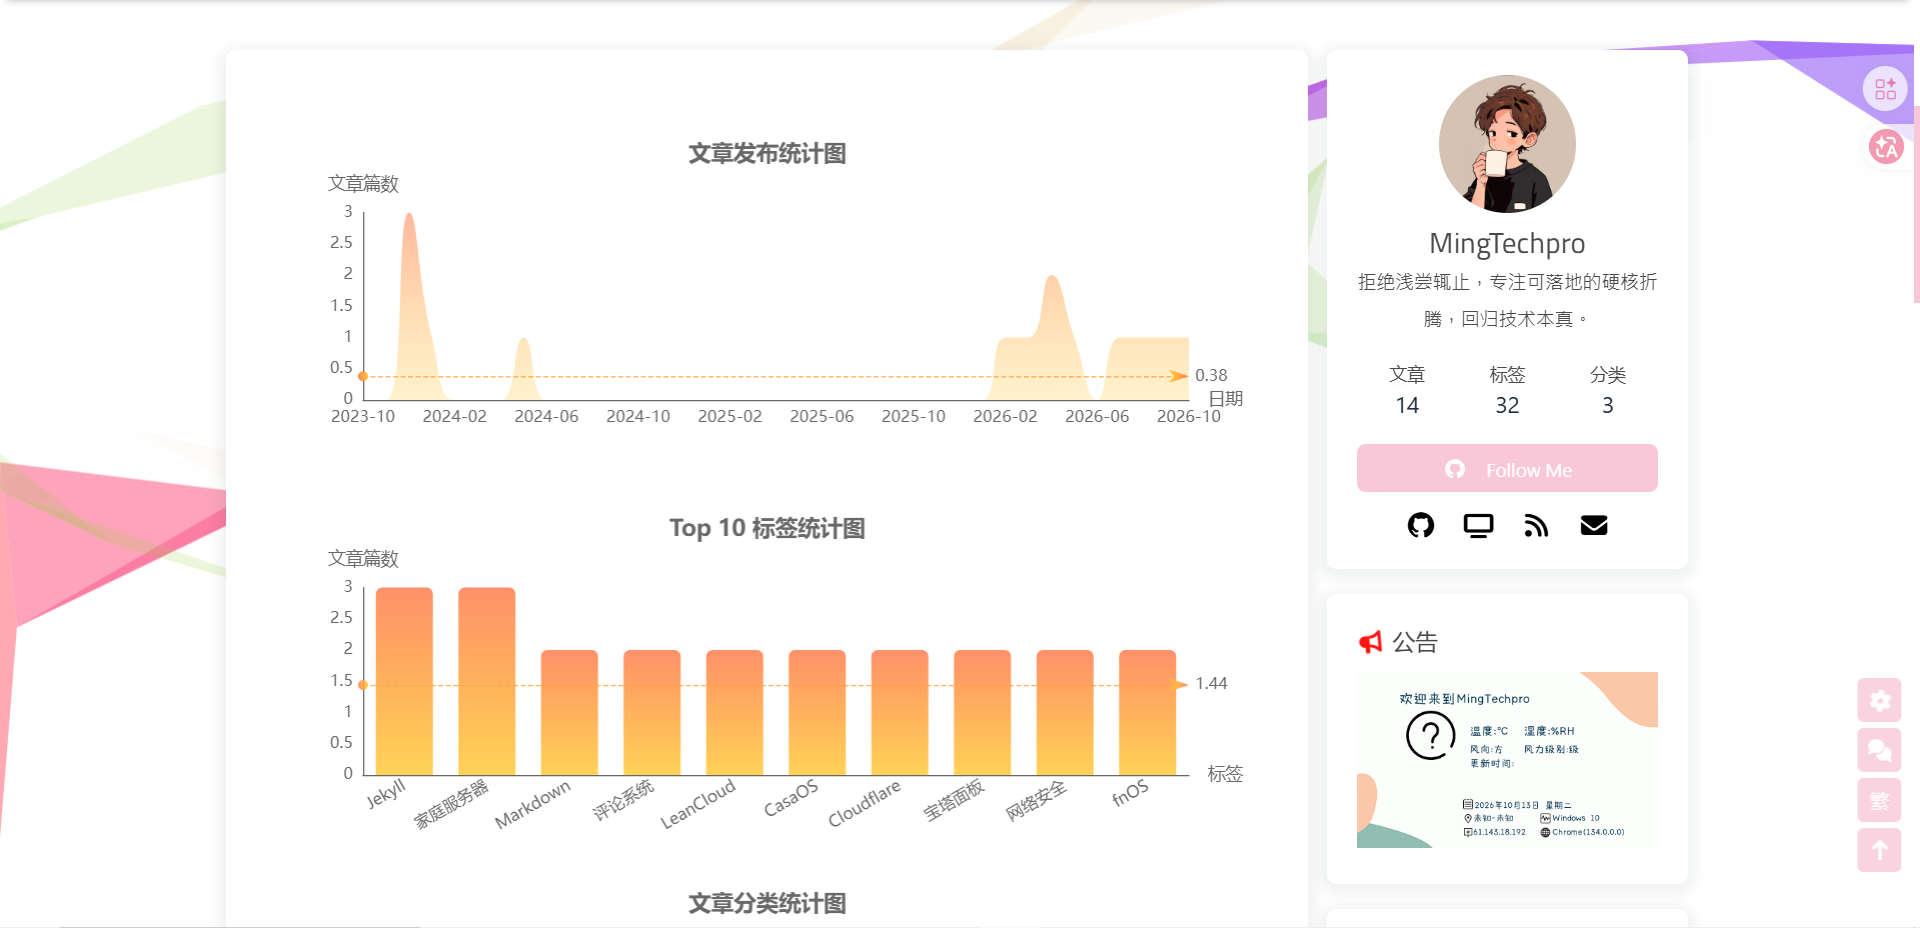
落日橙金

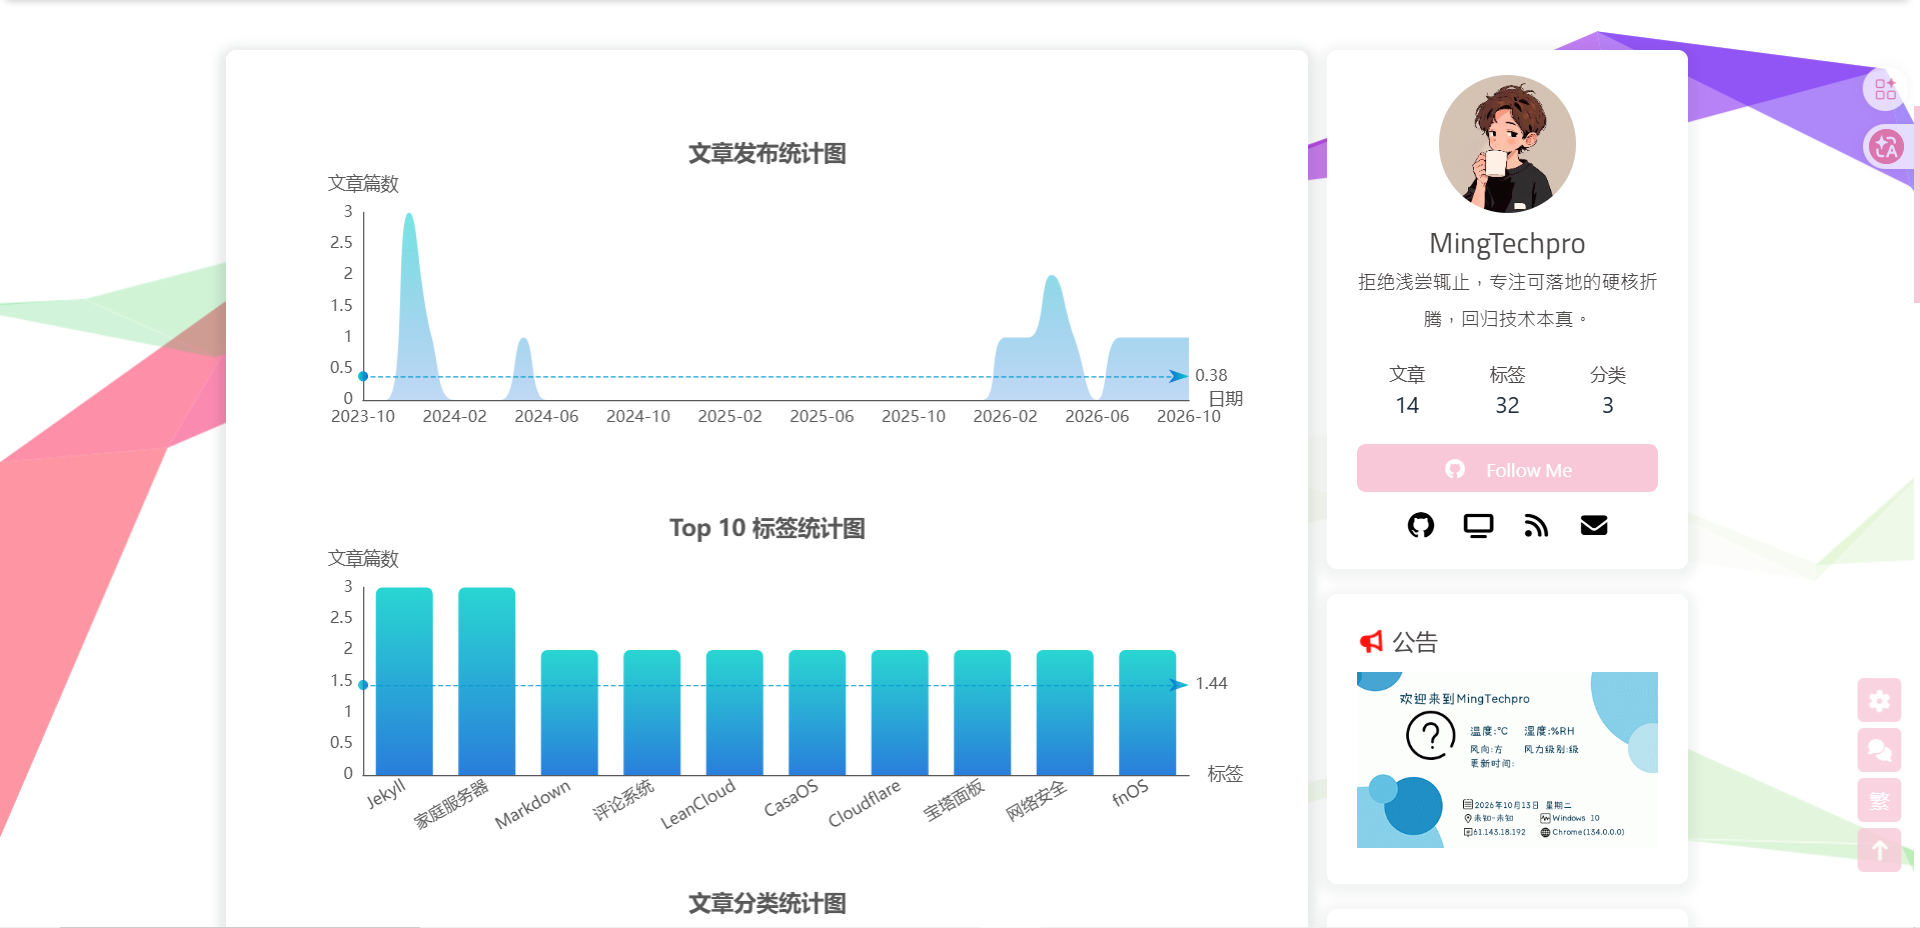
薄荷海蓝

极光翠绿

玫瑰酒红

总结

本教程基于 Hexo Butterfly,为已搭建好 站点状态页 的博客提供了一套 ECharts 图表可视化增强方案。通过「条件注入 + Hexo 生成器过滤器 + 渐变主题脚本」的组合方式,在不影响全局性能的前提下,为 Status 页面新增了三张动态数据图表。

核心实现要点回顾:

  • 按需加载:通过 inject.head 全局引入 ECharts CDN,或者配合 Status 页面 Front-matter 中的 echarts: true 字段,实现图表库的条件启用,避免在非状态页产生冗余请求。
  • 自动化数据注入:在 themes/butterfly/scripts/helpers/charts.js 中注册 after_render:html 过滤器,自动扫描页面中的 #posts-chart、#tags-chart、#categories-chart 占位元素,并注入对应的初始化脚本
  • 三图联动:
    • 📈 文章发布统计图:按月聚合,渐变面积折线图,点击跳转对应归档月
    • 🏷 标签统计图:Top 10 横向柱状图,渐变色填充,点击跳转标签页
    • 📁 分类统计图:玫瑰饼图,点击跳转分类页
  • 五套渐变主题:提供「紫粉渐变」「落日橙金」「薄荷海蓝」「极光翠绿」「玫瑰酒红」五种配色方案,适配不同博客视觉风格。
  • 交互与响应式:所有图表支持 resize 自适应、点击下钻、平均值参考线,桌面端与移动端均可正常渲染。

最终效果:一个数据实时、视觉统一、交互丰富的站点状态面板,将原本静态的数字指标升级为可探索的动态图表,既提升了访客的信息获取效率,又保持了 Butterfly 主题的整洁架构与可升级性。

💡 进阶提示:如需添加更多图表类型(如访客来源地图、小时级发布热力图),只需在 charts.js 中新增对应的渲染函数,并在 Status 页面 Markdown 中添加对应 id 的占位 div 即可,无需修改模板结构。